Track & Analyze Data With Ease
Access Analytics Anytime from Anywhere

Actionable Insights & Learnings For Executional Excellence
Dynamic Reporting Dashboards
PREP ASSISTANT
Live Prep Progress
Real-time insights into prep completion and crew efficiency—anytime, at a glance.

PREP ASSISTANT
Labor Efficiency & Food Waste Metrics
Insights into task completion, average times to complete tasks, and food waste costs, providing operators insights on how efficiently the crew is using the tool and opportunities to prevent food waste.

STATION ASSISTANT - MAKELINE
Food Waste & Cost Analytics
Insights into the monthly food cost savings per store due to less over-portioning and preparation of food through Predictive and Vision AI.

STATION ASSISTANT - MAKELINE
Availability & Service Metrics
Insights into food availability by ingredient and average hold times, giving operators a better understanding of how they are performing in terms of quality and speed-of-service, and opportunity to coach on areas of improvement.

STATION ASSISTANT - MAKELINE
Food Quality Measurement
Hold times displayed by ingredient and data around the freshest products based on hold times, giving operators insights into which ingredients are being prepared in accurate amounts and overproduction, allowing for the opportunity to produce less of low-demand ingredients.

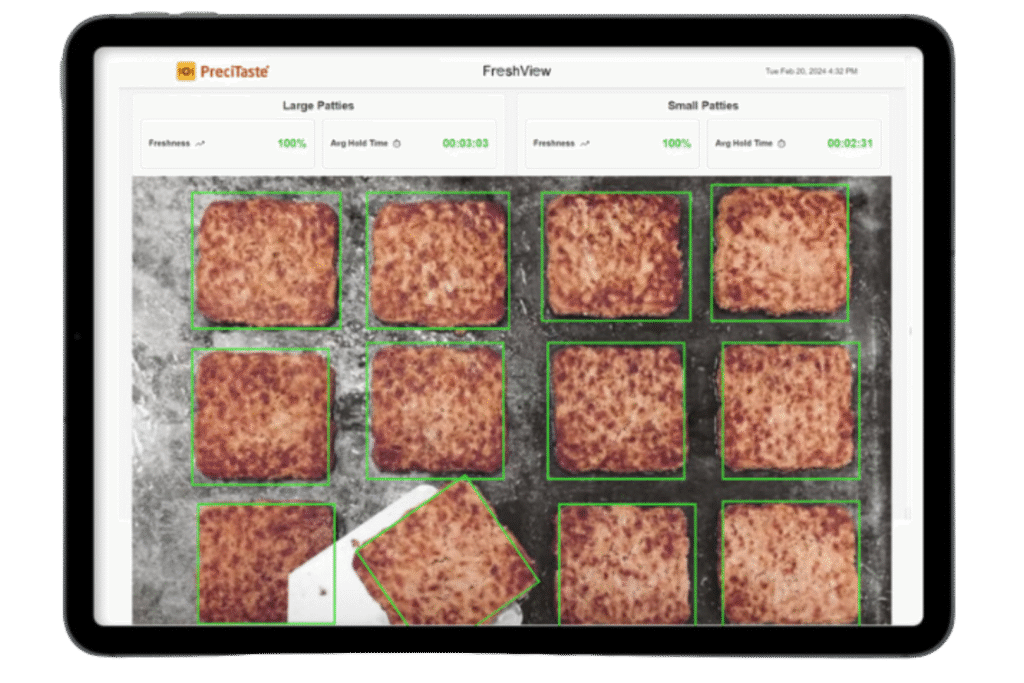
STATION ASSISTANT - GRILL
Quality & Freshness Metrics
Example of dashboard for hamburger grilling efficiency, displaying average hold times and percentage of fresh patties served based on hold time standards. These insights allow operators to compare stores using the system and discover opportunities for additional coaching.
Receive actionable data to continuously refine your kitchen’s efficiency


